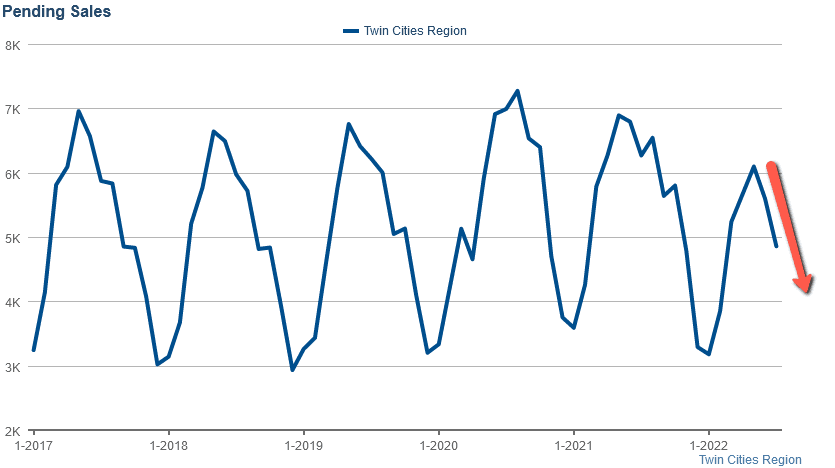
Only 4,856 homes, townhouses, condos, and lofts traded in the Twin Cities in July. That is the largest MOM collapse in pending sales for July since July of 2006 (just before the housing crisis) and is the lowest absolute level of pending sales in July since July of 2011 (while prices were forming a bottom), as higher prices and the higher cost of capital from the doubling of interest rates YTD, continue to put a strain on demand and overall sales volume.
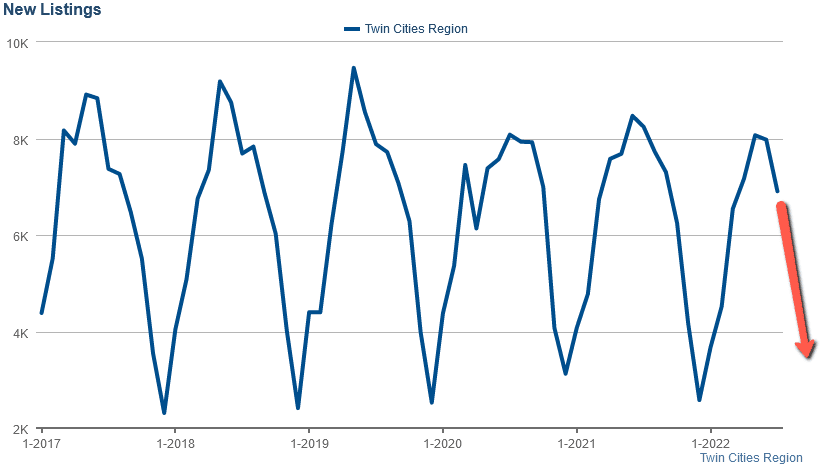
New listings also collapsed 13.1% MOM in July. So long as new listings continue to fall alongside falling demand, inventory will remain historically low which will keep a floor under home prices during the seasonal correction which we expect to last between now and the middle of January of 2023.
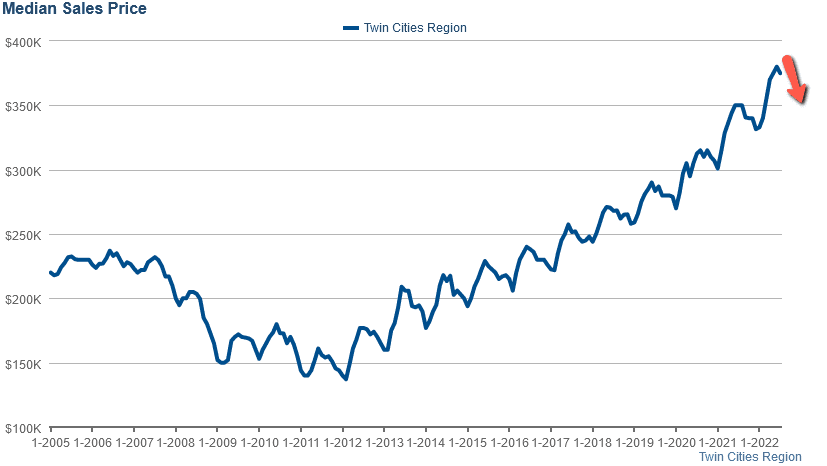
The Median Home Price: After a raging hot spring market, the median home price in the Twin Cities fell 1.3% in July to $375,000. That is up 7.1% YOY and we expect prices to continue to slowly soften between now and the end of the year.
New listings also collapsed 13.1% MOM in July. So long as new listings continue to fall alongside falling demand, inventory will remain historically low which will keep a floor under home prices during the seasonal correction which we expect to last between now and the middle of January of 2023.
The Median Home Price: After a raging hot spring market, the median home price in the Twin Cities fell 1.3% in July to $375,000. That is up 7.1% YOY and we expect prices to continue to slowly soften between now and the end of the year.
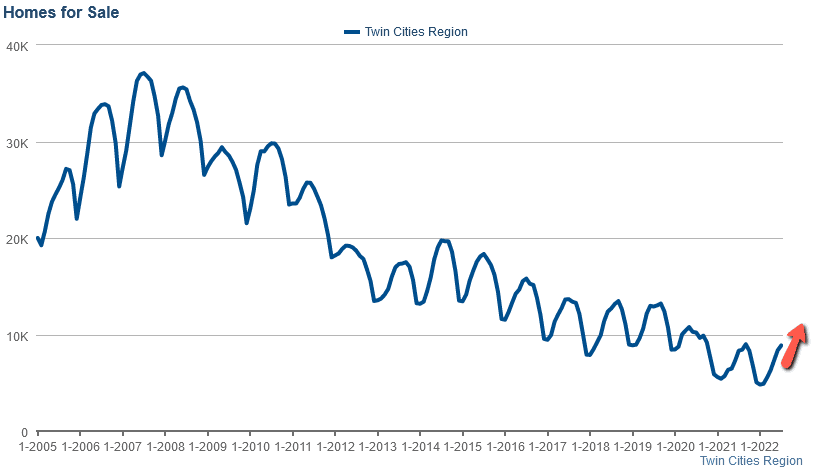
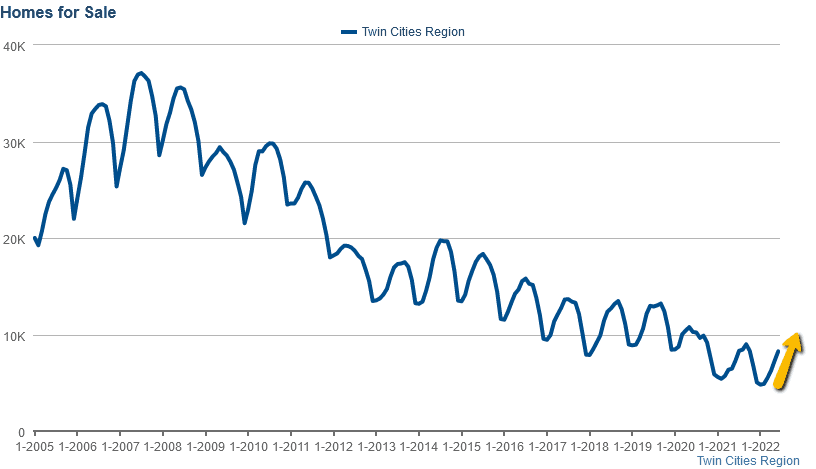
Home Inventory: The home inventory level in the Twin Cities moved up 6% in July to 8,865 units. That level is also up 6.6% YOY but remains very low, historically.
Pending Home Sales: 4,856 homes came under contract in the Twin Cities in July. That is down a whopping 13.1% MOM and down 22.5% YOY. That is the largest monthly collapse in pending sales during July since July of 2006 (just before the housing crisis) and the lowest absolute level of pending sales in July since July of 2011 (while prices were forming a bottom), as higher interest rates and higher prices continue to strain demand and sales volume. We expect pending sales to continue to decline through December or January before turning back up ahead of the spring of 2023.
New Listings: 6,906 new listings hit the Twin Cities market in July which is down a whopping 13.1% MOM and down 15.9% YOY. Collapsing affordability is primarily impacting demand but it is also secondarily impacting new listings as some move-up buyers are deciding to stay in their current homes in the face of the higher prices and rates. So long as new listings continue to fall dramatically alongside demand, that will keep a floor under housing prices during the off-season.
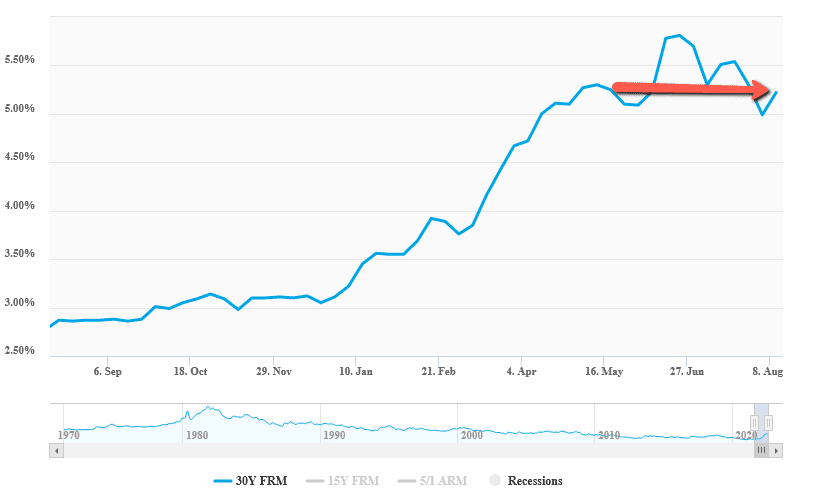
Mortgage Rates: The dramatic rise in mortgage rates has cooled off for the time being. Mortgage rates and interest rates in general peaked around June 25th and have been slowly softening since. The average 30-year-fixed mortgage in the U.S. as of August 15th, 2022 is 5.22%, down 5.2% MOM but still up 81% YTD.
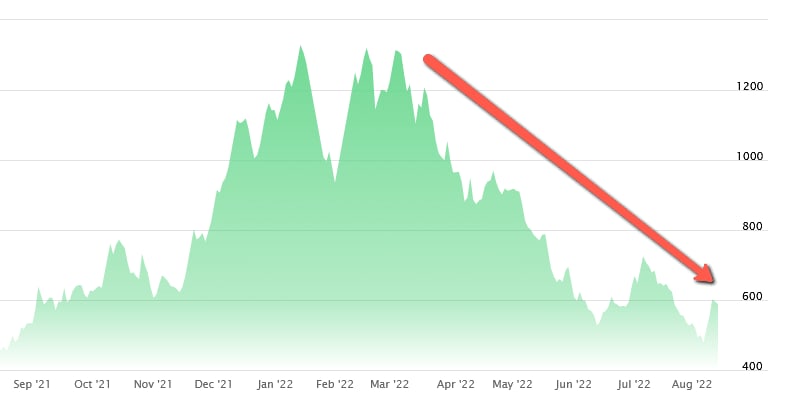
Lumber Prices: Lumber prices continue to dis-inflate along with some other commodities. They are down slightly MOM but are down more than 50% YTD.
Home Builder Confidence: "The NAHB housing market index in the US extended declines for an eighth straight month to 49 in August of 2022, the lowest reading since May of 2020 and well below market forecasts of 55. “Tighter monetary policy from the Federal Reserve and persistently elevated construction costs have brought on a housing recession. The total volume of single-family starts will post a decline in 2022, the first such decrease since 2011. However, as signs grow that the rate of inflation is near peaking, long-term interest rates have stabilized, which will provide some stability for the demand-side of the market in the coming months”, said NAHB Chief Economist Robert Dietz. The current sales subindex dropped 7 points to 57; buyer traffic fell to 32 from 37, and sales expectations in the next six months declined by 2 points to 49. source: National Association of Home Builders" source: National Association of Home Builders
This concludes my Twin Cities housing market insight for August of 2022. Please don't hesitate to call us at (952) 222-7653 if you would like to go more in depth on a particular market segment or dive into the current fair market value of a property that you currently own or manage.
Sources: NorthstarMLS, Infosparks Data, Hedgeeye Risk Management, FreddieMac.com, Nasdaq.com, TradingEconomics.com, fred.stlouisfed.org
Sources: NorthstarMLS, Infosparks Data, Hedgeeye Risk Management, FreddieMac.com, Nasdaq.com, TradingEconomics.com, fred.stlouisfed.org