You can track the Twin Cities housing market data here. You can track mortgage rates here. You can track homebuilder confidence here. You can track lumber prices here.
As of August 30th, the median home price in the Twin Cities is up 17% YTD, an epic incline that falls in line with our forecast from back in February. With that said, lumber prices have corrected (although still above pre-pandemic levels), inventory has recovered (although still at a seasonally adjusted record low) and the seasonal correction in housing prices, which typically begins in June (but has been delayed the past two years due to pandemic induced dynamics) does appear to have begun as we head into a more relaxed, fall market. It should also be noted that the pandemic and civil unrest-induced migration patterns that were holding down price inflation for the inner luxury markets have eased and that although the suburb markets have still been outperforming, the city markets have begun to recover.
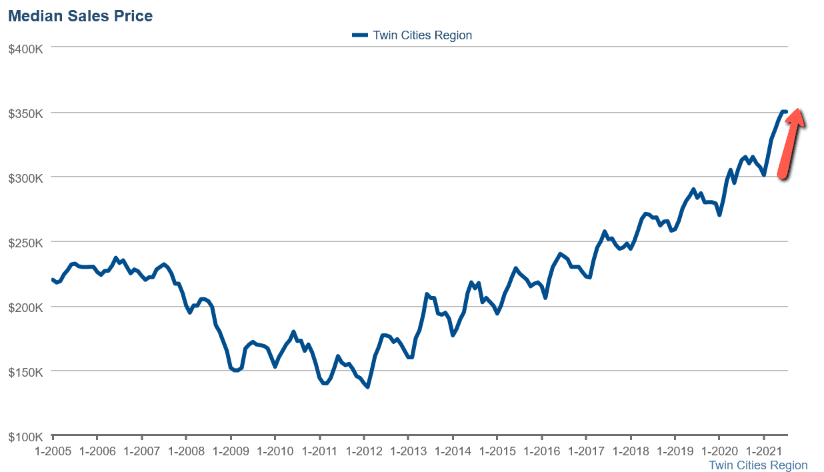
The Median Home Price: With record low housing inventory, record low mortgage rates, and inflating prices for goods and services in the construction sector persisting through the pandemic, the seasonal correction in home prices from last winter was stifled while the seasonal boom was maximized, resulting in a 12% YOY net increase (from peak to peak) for the median home price as compared to an average of 8.7% for the Twin Cities during the 7 years preceding the pandemic. As of August 30th, the median home price in the Twin Cities sits at a new record high of $350,000.
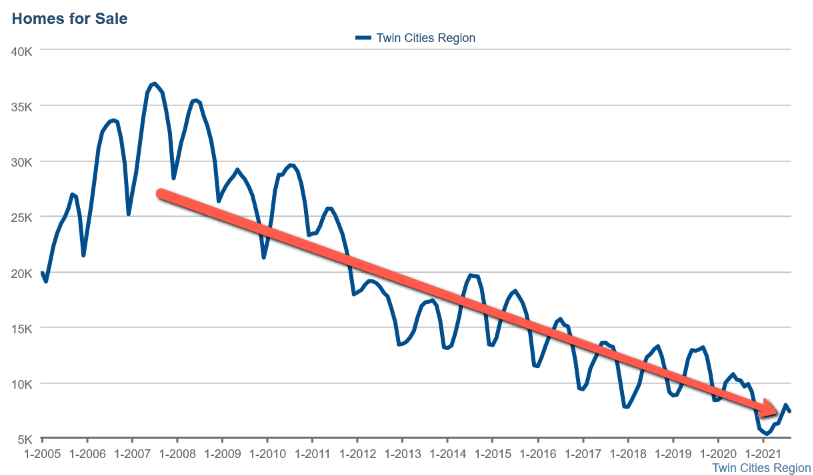
Home Inventory: As of August 30th, there are 7,915 active homes, townhouses, and condos for sale in the Twin Cities market which is a seasonally adjusted, record low (down 22% year over year and down 38% over two years). Month's Supply of Inventory also sits at a seasonally adjusted record low at 1.4 months down from 2.0 months, YOY. As you can see by the chart below, inventory had already trended to record low levels preceding the pandemic and then pandemic-inspired, inflationary dynamics caused the situation to exacerbate.
The Median Home Price: With record low housing inventory, record low mortgage rates, and inflating prices for goods and services in the construction sector persisting through the pandemic, the seasonal correction in home prices from last winter was stifled while the seasonal boom was maximized, resulting in a 12% YOY net increase (from peak to peak) for the median home price as compared to an average of 8.7% for the Twin Cities during the 7 years preceding the pandemic. As of August 30th, the median home price in the Twin Cities sits at a new record high of $350,000.
Home Inventory: As of August 30th, there are 7,915 active homes, townhouses, and condos for sale in the Twin Cities market which is a seasonally adjusted, record low (down 22% year over year and down 38% over two years). Month's Supply of Inventory also sits at a seasonally adjusted record low at 1.4 months down from 2.0 months, YOY. As you can see by the chart below, inventory had already trended to record low levels preceding the pandemic and then pandemic-inspired, inflationary dynamics caused the situation to exacerbate.
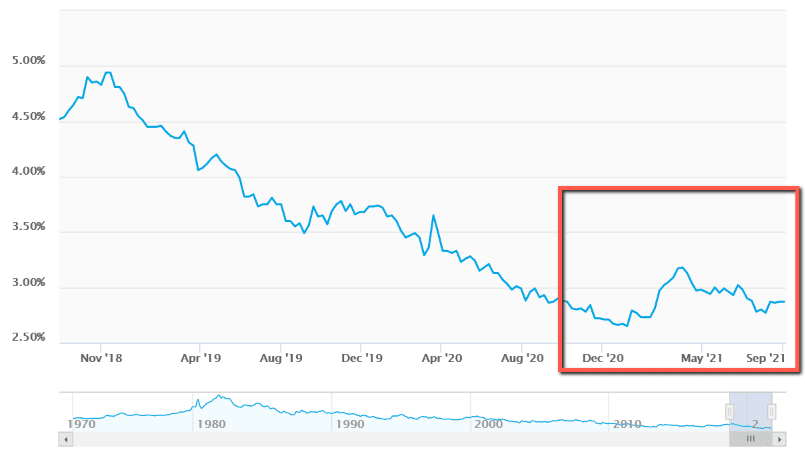
Mortgage Rates: Mortgage rates remain virtually unchanged YOY and currently sit at 2.87% for the average 30-year fixed conventional mortgage which is just above the all-time record low of 2.65%. Mortgage-backed securities aside, The Federal Reserve's balance of U.S. treasuries has grown 130% in the past 12 months. So far since the beginning of the pandemic, the Federal Reserve's entire balance sheet has more than doubled from $4 trillion to more than $8 trillion. So long as the Federal Reserve continues with this unprecedented monetary intervention (using an ever-expanding supply of US dollars to buy unprecedented volumes of treasuries and mortgage-backed securities), mortgage rates are likely to remain historically low.
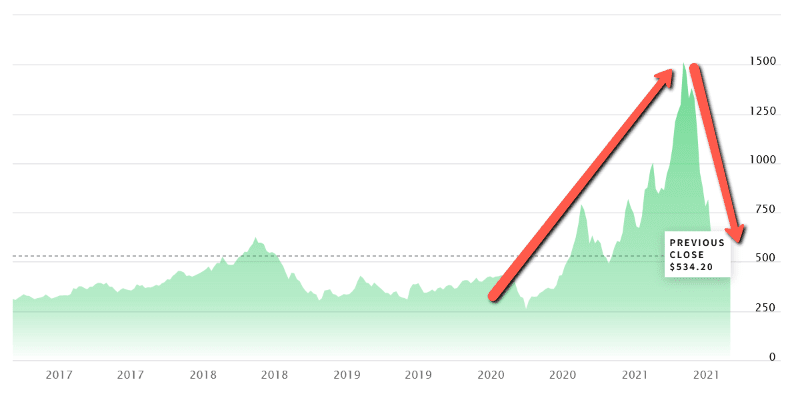
Lumber Prices: As economic pause / lock-down induced supply chain stresses have eased, so has the price of lumber which has come down almost 70% since its peak back in May. With that said, the lumber price currently sits at $535 per 1,000 board feet which is still 40% above the 2019 average. I think this scenario is evidence that certainly some of the inflation that we have witnessed has been transitory but unless the monetary environment changes, a more pronounced and steady rise in the price of goods and services is likely to be part of the post-pandemic, "new normal". This dramatic correction in lumber prices will help to bring the cost of building back down to a feasible level for some areas which could take a little bit of the pressure off of the inventory level down the road but if the price of lumber continues a steady underlying rise, builder confidence will continue to erode.
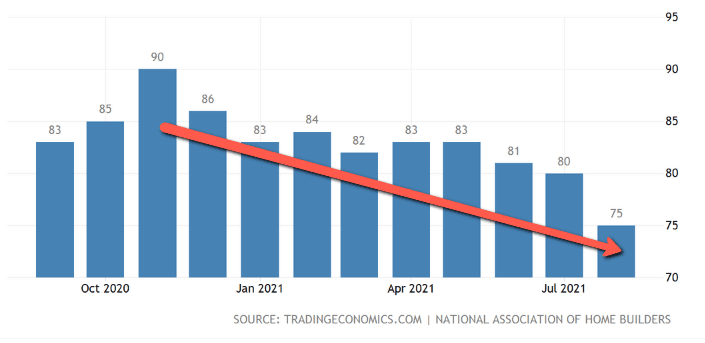
Home Builder Confidence: The NAHB housing market index in the US dropped to 75 in August 2021, the lowest since July 2020 and well below market expectations of 80. Builder confidence has been in steady decline since November of 2020. Builders have cited concerns about elevated levels of price inflation and ever-stretching home affordability as primary factors for the decline in confidence.
Looking Forward: If the historical cycle repeats as it usually does, we are expecting a recovery from the Labor Day lull and a pretty strong market for the remainder of September, followed by a correction in home prices of 3 - 6% for closed sales from November through January. During that period, buyer activity will certainly slow dramatically but so will the rate of new listings so we are expecting home inventory to decline over that time to at or near a new record low, setting up for another strong spring market for price growth in 2022.
This concludes my Twin Cities housing market insight for August of 2021. Please don't hesitate to call us at 952-222-SOLD if you would like to go more in-depth on a particular market segment or dive into the current fair market value of a property that you currently own or manage.